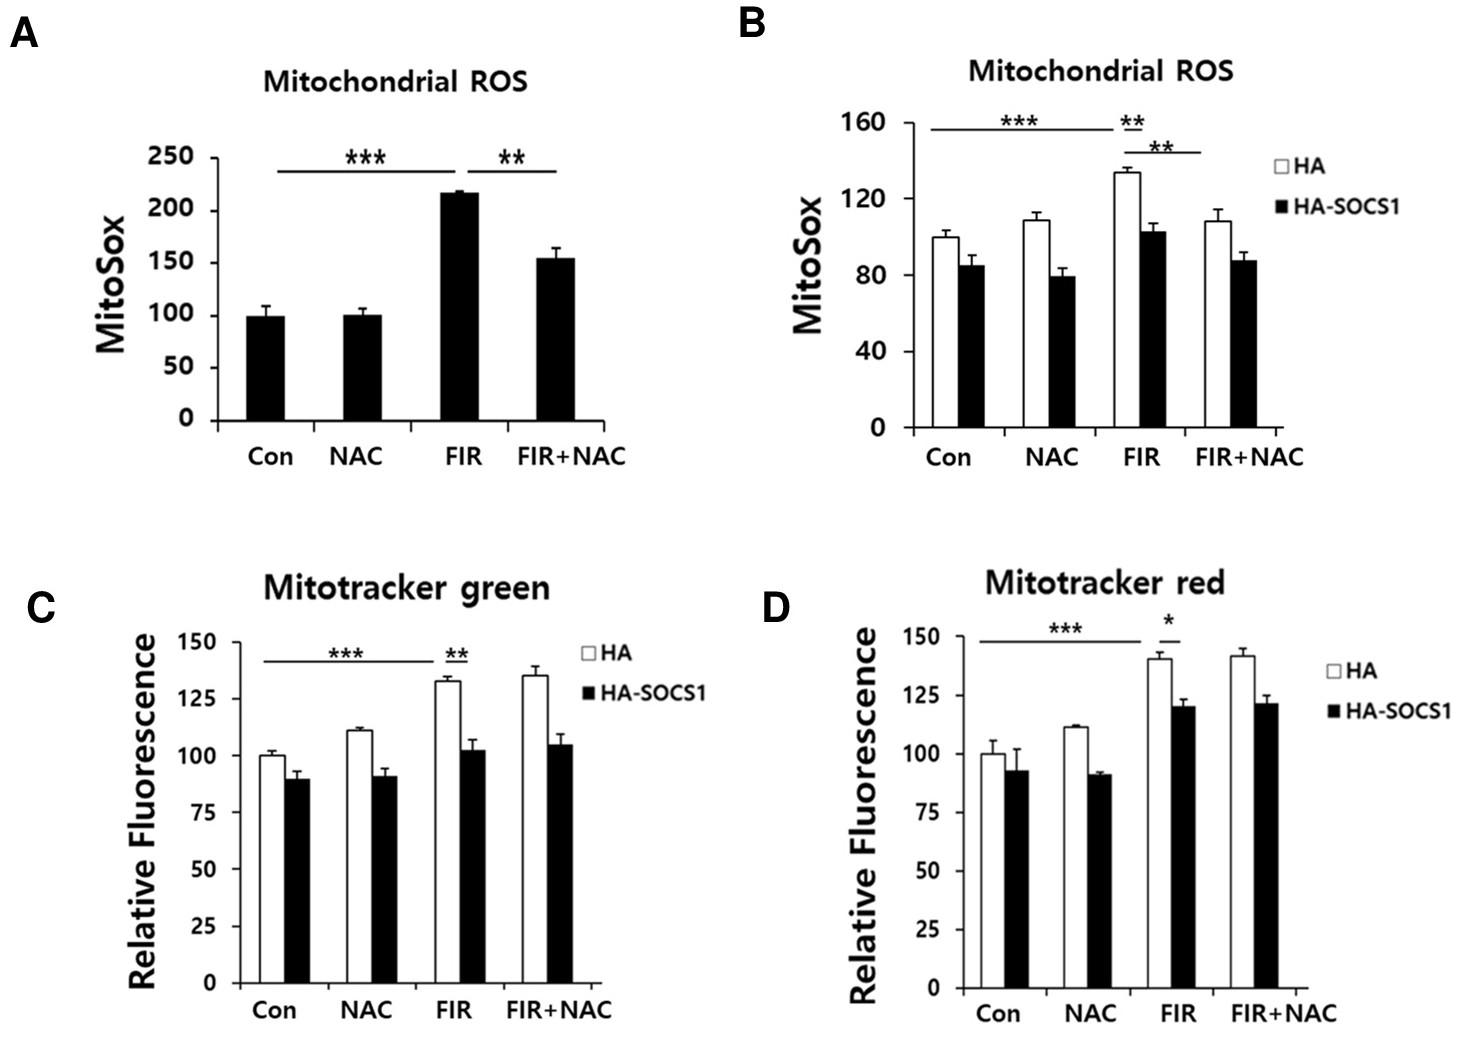
Fig. 6. Induction of mitochondrial ROS by FIR which is suppressed by SOCS1. (A) HCT116 p53+/+ cells received FIR treatment were analyzed for the mitochondrial ROS levels at 30 min post irradiation by Mitosox staining as described in the text. (B) The HA vs HA-SOCS1 cells were compared for mitochondrial ROS generation upon FIR treatment as in panel A. (C and D) These HA & HA-SOCS1 cells were analyzed for total mitochondria as well as functional mitochondria by staining with Mitotracker green and Mitotracker red dyes, respectively. Data were obtained from 3 independent experiments performed in triplicate wells (*, p ≤ 0.05; **, p ≤ 0.01; ***, p ≤ 0.005).